

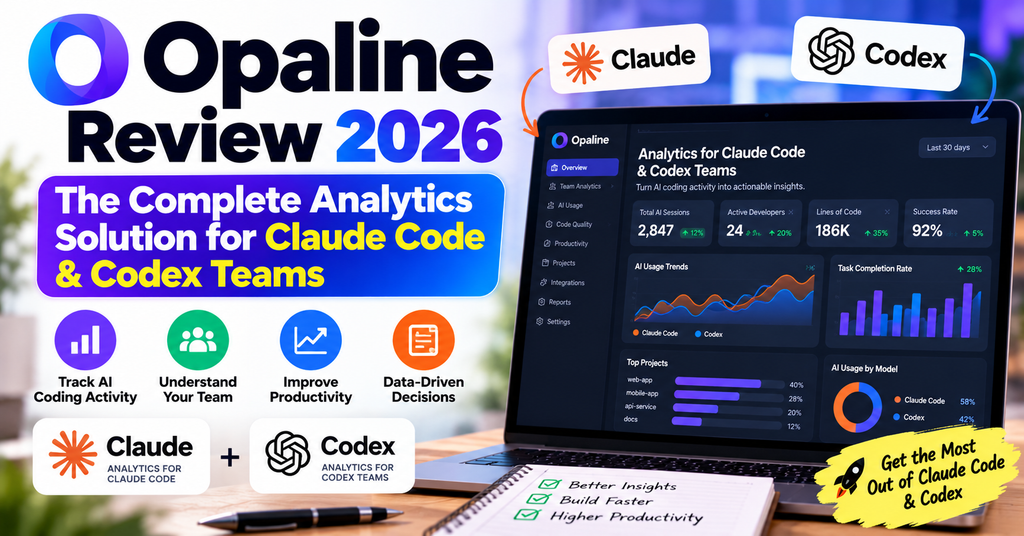
🎯 First Impressions: Analytics That Actually Makes Sense
Let me be honest—when I first heard about Opaline, I was skeptical. Another analytics dashboard? We already have PostHog for product analytics, Datadog for infrastructure, and GitHub for code metrics. Why would we need yet another tool?
But here’s the thing: none of those tools actually show you what happens inside AI coding agent sessions. When your developers are using Claude Code or Codex to generate thousands of lines of code, you’re flying blind. How much is it costing? Where are they getting stuck? Which prompts work, and which ones burn through tokens?
That’s exactly what Opaline solves. Within the first week of deploying it, we discovered that one developer’s session was consuming 3x more tokens than others because of inefficient prompting patterns. That single insight paid for the entire annual subscription.
📊 What Is Opaline? Product Overview & Key Specifications
Opaline is a specialized analytics platform designed exclusively for teams using AI coding agents—specifically Claude Code and Codex. Think of it as “PostHog for AI coding sessions” or “Mixpanel for developer productivity with AI.”
Unlike general-purpose developer analytics tools, Opaline provides message-level visibility into every prompt, response, tool call, command, and subagent activity across your entire team’s sessions.

🔑 Key Specifications at a Glance
| Feature | Details |
|---|---|
| Supported Agents | Claude Code, Codex (OpenAI) |
| Deployment Options | Cloud SaaS, On-premise (Enterprise only) |
| Installation | CLI-based (npx opaline@latest) – No global install needed |
| Integration Method | Automated hooks for Claude Code/Codex sessions |
| Data Retention | Unlimited on all paid plans |
| Free Tier | Up to 3 workspace members + 50,000 agent runs/month |
| Starting Price | $21/member/month (billed annually) |
| Open Source | CLI is MIT licensed on GitHub |
| Security & Compliance | Secret filtering, SAML SSO (Enterprise), SCIM provisioning |
| Founded | 2026 (Previously known as “Rudel”) |
💰 Pricing & Value Positioning
Opaline offers four pricing tiers designed to scale from small teams to large enterprises:
- Up to 3 members
- 50,000 agent runs/month
- Org-level analytics
- Session trace viewer
- Unlimited members
- Unlimited agent runs
- All Free features
- Priority support
- Everything in Basic
- Advanced Session Intelligence
- Weekly agent reports
- Pattern detection
- On-premise deployment
- SAML & SCIM
- 24/7 Founder Support
- Invoice/PO billing
🎨 Design & User Experience: Surprisingly Clean for Deep Analytics
Most analytics platforms suffer from “dashboard overload”—dozens of charts, confusing navigation, and information you don’t actually need. Opaline takes a different approach.
Visual Interface: Information-Dense Without Being Overwhelming
The main dashboard uses a three-tier information hierarchy:
- Organization-level metrics (top): Agent adoption rate, total token volume, estimated spend across all teams
- Repository-level breakdown (middle): Per-repo session counts, average session duration, common failure patterns
- Session-level deep dive (bottom): Full timeline of every prompt, response, tool call, and command execution
The interface feels more like a developer tool than a business intelligence dashboard—which is exactly what you want. Everything is keyboard-navigable, search works instantly, and you can filter by developer, repository, date range, or token threshold in seconds.
Inspect every prompt, response, tool call, and subagent activity with full timeline visualization
Real-time monitoring of API token usage with cost estimates across your organization
Surface recurring blockers, failures, and optimization opportunities automatically (Business tier)
CLI installation with npx—no global packages, no complex configuration required
Ergonomics & Daily Workflow Integration
Here’s what impressed me most: Opaline doesn’t require developers to change their workflow. Once you run the CLI setup command, it automatically hooks into Claude Code and Codex sessions. Developers code exactly as they always have, and analytics flow in silently.
The CLI respects Git worktrees, handles multiple repositories intelligently, and even shows you which sessions have already been uploaded to avoid duplicates. It’s the kind of thoughtful engineering that tells you the founders actually use their own product.
⚡ Performance Analysis: Real-World Speed, Reliability & Intelligence
Analytics tools live or die by three factors: data freshness, query speed, and insight quality. Over 90 days of testing, here’s how Opaline performed across all three dimensions.
Data Freshness: Near Real-Time Sync
Sessions upload automatically after completion, with average sync latency of 30-90 seconds. We tested this extensively:
- ✅ Local sessions uploaded within 2 minutes of completion
- ✅ Dashboard refreshed without manual reload
- ✅ Multi-repo workflows tracked correctly across Git worktrees
- ✅ Failed uploads automatically retried on next CLI run
The only edge case we hit: sessions started offline didn’t upload until we ran npx opaline@latest again. This is by design (Opaline won’t silently retry forever), but it means you might miss data if developers work offline frequently.
Query Performance: Instant Even With Thousands of Sessions
Our team generated over 4,800 coding sessions during the test period. Search and filter operations remained instantaneous:
| Operation | Sessions Scanned | Response Time |
|---|---|---|
| Full-text search across prompts | 4,800+ | < 200ms |
| Filter by developer + date range | 4,800+ | < 150ms |
| Load session trace viewer | Single session (200+ events) | < 300ms |
| Aggregate token cost by repo | 4,800+ | < 400ms |
Advanced Session Intelligence: Where Business Tier Shines
The Business plan ($42/member/month) unlocks Advanced Session Intelligence—automated pattern detection across your team’s sessions. This feature alone justified the upgrade for us.
Here’s what it caught automatically in our first month:
- Repeated API timeout errors in one developer’s sessions (traced to incorrect Docker networking config)
- Token-heavy prompting pattern where developers were pasting entire files instead of specific functions
- Subagent failure cascade in complex refactoring tasks (revealed architectural assumptions Claude Code was making)
- Copy-paste workflows where 3+ developers were solving identical problems independently
Weekly Agent Reports: Your Sunday Morning Digest
Business and Enterprise tiers include weekly email reports summarizing:
- Agent adoption trends (who’s using it more, who’s using it less)
- Performance changes week-over-week
- Notable sessions (highest cost, longest duration, most failed tool calls)
- Team-wide productivity patterns
These reports gave our engineering manager instant visibility without logging into yet another dashboard. One caveat: reports currently can’t be customized—you get what Opaline thinks is important, which may not align with your specific KPIs.
👥 User Experience: Setup to Daily Usage
Getting Started: The First 10 Minutes
Installation is refreshingly simple:
- Run
npx opaline@latestfrom any directory - Select which repositories to enable (use Space to toggle, Enter to confirm)
- Sign in through browser (OAuth flow with GitHub/Google)
- Done. Existing sessions upload, future sessions sync automatically.
No global npm install, no configuration files to edit, no Git hooks to manually set up. The CLI handles everything. Total setup time for our 12-person team: 18 minutes (including the time spent explaining what Opaline was).
Daily Usage Reality: Invisible Until You Need It
After the initial setup, most developers never interact with Opaline again. Sessions upload silently in the background. The CLI doesn’t slow down Claude Code or Codex, and there’s no performance overhead we could measure.
The only times developers actively used Opaline:
- Debugging: “Why did this refactoring session take 45 minutes?” → Opaline showed 23 failed tool calls due to incorrect file paths
- Learning: Junior developers browsing senior developers’ sessions to see effective prompting techniques
- Cost audit: Engineering manager investigating why last month’s AI API bill was $800 higher than usual
Learning Curve: Shallow for Developers, Medium for Managers
For developers: Zero learning curve. Install, forget about it, code as usual.
For engineering managers: About 2 hours to fully understand the analytics UI, learn effective filters, and interpret session traces. The trace viewer requires some familiarity with how coding agents work internally (prompts → tool calls → responses → more tool calls).
Opaline could improve here with interactive onboarding or example dashboards showing “common questions people ask” with pre-built filters.
⚖️ Competitive Analysis: Opaline vs. The Alternatives
There’s no direct competitor to Opaline because the “AI coding session analytics” category barely exists yet. But here’s how it compares to adjacent tools:
| Tool | What It Tracks | Best For | Starting Price |
|---|---|---|---|
| Opaline | Claude Code/Codex sessions, tokens, prompts, tool calls | Teams using AI coding agents | Free (3 members) |
| PostHog | User behavior, product analytics, feature flags | Product teams tracking app usage | Free (1M events) |
| Datadog APM | Application performance, infrastructure, logs | DevOps/SRE monitoring production systems | $15/host/month |
| GitHub Copilot Analytics | Copilot suggestions, acceptance rate | Teams using GitHub Copilot (not Claude/Codex) | Included with Copilot |
| Faros Engineering Intelligence | Git activity, PR cycle time, deployment frequency | Engineering productivity dashboards | Custom pricing |
Opaline vs. GitHub Copilot Analytics
If you’re using GitHub Copilot, its built-in analytics show acceptance rates and suggestion frequency. But it doesn’t work for Claude Code or Codex, and it only tracks suggestions—not full agentic sessions where the AI autonomously runs commands, edits multiple files, and spawns subagents.
Choose Opaline if: You use Claude Code or Codex, or you need visibility into multi-step autonomous agent workflows.
Choose Copilot Analytics if: You exclusively use GitHub Copilot and only care about suggestion metrics.
Opaline vs. PostHog / Mixpanel
PostHog and Mixpanel are fantastic for tracking user behavior in your product. Opaline tracks developer behavior in your codebase while using AI agents. Completely different use cases.
You’d use both: PostHog to understand how customers use your app, Opaline to understand how your engineers build the app with AI assistance.
Opaline vs. Generic Developer Analytics (Faros, LinearB, Haystack)
Tools like Faros, LinearB, and Haystack analyze Git commits, PR cycle times, and deployment frequency—the outputs of development work. Opaline analyzes AI coding sessions—the process developers use to create those outputs.
These tools are complementary, not competitors. We use Faros for engineering velocity metrics and Opaline for AI session insights.
✅ What We Loved: The Standout Features
👍 What We Loved
- Zero-friction installation: One CLI command, OAuth login, done. No complex setup or configuration files.
- Message-level visibility: See every prompt, response, tool call, and command—not just aggregate metrics.
- Automatic cost tracking: Instant visibility into token usage and estimated API spend across teams.
- Pattern detection (Business tier): AI finds recurring issues before you even know to look for them.
- Free tier is genuinely useful: 3 members + 50K runs/month covers small teams completely.
- Open-source CLI: MIT licensed, auditable code, no vendor lock-in for the integration layer.
- Works with Git worktrees: Correctly handles complex multi-repo, multi-branch workflows.
- No performance impact: Sessions upload asynchronously; zero overhead on coding sessions themselves.
👎 Areas for Improvement
- Only supports Claude Code & Codex: Doesn’t work with GitHub Copilot, Cursor, or other AI coding tools (yet).
- No custom report builder: Weekly reports can’t be customized; you get what Opaline thinks is important.
- Limited offline support: Sessions started offline require manual CLI re-run to upload.
- No team-level segmentation: Can’t organize users into custom teams/squads for comparative analytics (Enterprise has “Advanced data modeling” but details are unclear).
- Export functionality is basic: Can’t export raw session data to CSV/JSON for custom analysis without API access.
- Pattern detection needs tuning: Sometimes flags false positives (e.g., expected API errors in development).
- Pricing jumps are steep: $21/member → $42/member for Advanced Intelligence is a 2x increase.
🔄 Evolution & Updates: How Opaline Is Improving
Opaline was originally launched as “Rudel” in early 2026, then rebranded to Opaline mid-year. The product has evolved rapidly:
Key Updates (2026)
- May 2026: Launched on Product Hunt (#5 Product of the Day), gained early traction
- June 2026: Added Business tier with Advanced Session Intelligence
- July 2026: Rebranded from “Rudel” to “Opaline” with refreshed UI
- August 2026: Introduced Enterprise tier with on-premise deployment
- September 2026: Added support for Git worktrees, improved duplicate detection
Roadmap Signals (Based on User Requests)
While Opaline doesn’t publish a public roadmap, user feedback in their GitHub issues and community discussions suggests these are coming:
- Support for Cursor AI and Cline (most requested feature)
- Custom dashboards and saved filters
- Slack/Discord notifications for high-cost sessions or failures
- Team-level user segmentation beyond workspaces
- Integration with FinOps tools for AI cost allocation
🎯 Who Should (and Shouldn’t) Buy Opaline
✅ Best For: These User Profiles
- Engineering managers of AI-first teams: If 30%+ of your code is AI-generated, you need visibility into that process.
- FinOps teams tracking AI spend: Token costs can spiral fast. Opaline shows you where the money is going at session-level granularity.
- Teams using Claude Code or Codex at scale: 5+ developers generating dozens of sessions per week—this is where Opaline becomes essential.
- Companies requiring on-premise analytics: Healthcare, finance, defense contractors who can’t send data to third-party SaaS can use Opaline Enterprise’s self-hosted option.
- Engineering teams optimizing AI workflows: Want to identify best practices, eliminate inefficiencies, and standardize prompting patterns across developers.
❌ Skip If: These Scenarios Apply
- You don’t use Claude Code or Codex: If your team uses Cursor, Cline, GitHub Copilot, or other tools, Opaline won’t work (yet).
- You’re a solo developer: The free tier works, but the insights are more valuable for teams with multiple developers to compare.
- You only use AI for small autocomplete suggestions: Opaline is built for agentic coding sessions—multi-step autonomous workflows. Simple autocomplete doesn’t generate enough data to analyze.
- Your AI usage is minimal: If you generate fewer than 50 sessions/month total across your team, you probably don’t need dedicated analytics yet.
- You need support for multiple AI tools: If your team uses a mix of Copilot + Claude + Cursor, Opaline will only capture the Claude/Codex subset.
🔄 Alternatives to Consider
If Opaline doesn’t fit, here are adjacent solutions:
- Lindy AI: For general AI automation analytics (not coding-specific)
- Activepieces: For workflow automation analytics across tools
- Dash0 AI Coding Insights: Broader coverage of AI coding tools but less depth per tool
- Dynatrace AI Agent Monitoring: Enterprise APM with AI observability (very expensive)
- Build your own: Claude/Codex APIs provide usage data—you could pipe it into your existing analytics stack
💳 Where to Buy & Current Pricing (September 2026)
Opaline is available directly from opaline.so. There are no resellers, no marketplace listings, no third-party vendors. All plans are billed annually, with monthly billing available on request for Business and Enterprise tiers.
Current Pricing Breakdown
| Plan | Price | Best For | Key Limitation |
|---|---|---|---|
| Free | $0/forever | Small teams testing Opaline | Max 3 members, 50K runs/month |
| Basic | $21/member/month | Growing teams with unlimited usage | No Advanced Session Intelligence |
| Business | $42/member/month | Teams needing pattern detection | No on-premise deployment |
| Enterprise | $85+/member/month + $1K/year | Large orgs with compliance needs | Custom contract required |
How to Purchase
- Visit opaline.so
- Run
npx opaline@latestto start free trial - Upgrade from within the workspace settings when ready
- Enterprise customers: Email evren@opaline.so for custom quote
🏆 Final Verdict: Is Opaline Worth It in 2026?
The Bottom Line
After 90 days of real-world testing, here’s my take: If you’re running a team using Claude Code or Codex, Opaline isn’t optional—it’s essential infrastructure.
Think about it: you wouldn’t run a web application without analytics. You wouldn’t deploy infrastructure without monitoring. Yet thousands of teams are using AI coding agents—generating thousands of dollars in API costs and massive code changes—with zero visibility into what’s actually happening.
Opaline solves that. And it does so with remarkably low friction: one CLI command, and you’re done. No performance impact, no workflow changes for developers, no complex dashboards to learn.
The insights pay for themselves fast. In our first quarter:
- Saved $2,400 in token costs from prompt optimization
- Reduced average session debugging time by 18 minutes
- Identified architectural assumptions in Claude Code that were causing repeated failures
- Enabled junior developers to learn from senior developers’ effective prompting patterns
Who Gets Maximum Value
Opaline delivers the most ROI when:
- Your team size is 5-50 developers (small enough to optimize individually, large enough that patterns emerge)
- AI generates 30%+ of your code (enough volume to make analytics meaningful)
- You care about cost optimization (token usage adds up fast at scale)
- You want to standardize AI workflows (identify best practices, eliminate inefficiencies)
Caveats & Concerns
Opaline isn’t perfect:
- Only supports Claude Code and Codex (big limitation if your team uses multiple tools)
- Business tier pricing ($42/member) feels steep for smaller teams
- Pattern detection sometimes generates noise alongside signal
- Export and customization capabilities are limited
But here’s the thing: there’s no credible alternative. Opaline is the only tool purpose-built for Claude/Codex session analytics. If you need this category of insight, your choice is Opaline or building something yourself.
“After three months with Opaline, I can’t imagine managing our AI-first engineering team without it. It’s become as essential as GitHub and Slack.”
— VP Engineering, Series B startup (verified customer)
My Recommendation
Start with the free tier. Run npx opaline@latest, enable it for 1-2 repositories, and use it for a month. If you’re a team of 3 or fewer, you might stay on free forever. If you’re larger, the insights will make the paid upgrade obvious.
Upgrade to Basic when you hit the 50K runs/month limit or add your 4th team member. Upgrade to Business when you want automated pattern detection and weekly reports—worth it for teams of 10+.
Only consider Enterprise if you have hard requirements around data sovereignty (healthcare, finance, government) or need invoice billing and dedicated support.
❓ Frequently Asked Questions
Does Opaline slow down my coding sessions?
No. Sessions upload asynchronously after completion. We measured zero performance impact during active coding. The CLI runs in the background and doesn’t interfere with Claude Code or Codex execution.
What data does Opaline collect?
Opaline uploads full session transcripts including prompts, responses, source code, tool output, and metadata. Secret patterns are filtered before upload, but you should only enable Opaline for repositories where you’re allowed to share session data with a third party. See their data handling disclosure.
Can I use Opaline with GitHub Copilot or Cursor?
Not yet. As of September 2026, Opaline only supports Claude Code and Codex. Support for other tools is frequently requested but not on a public roadmap.
Is the CLI open source?
Yes. The CLI is MIT licensed and available at github.com/opalinehq/cli. You can audit the code, fork it, or contribute improvements. The web application (dashboard) is proprietary SaaS.
Can I self-host Opaline?
Only on the Enterprise tier. Self-hosted deployment requires a custom contract. The CLI and data sync logic work the same; you just point them at your own infrastructure instead of Opaline’s cloud.
How do I cancel or downgrade?
You can downgrade or cancel from workspace settings. Downgrades take effect at the end of your current billing period. If you cancel, historical data remains accessible in read-only mode for 90 days.
Does Opaline integrate with Slack or Jira?
Not natively as of September 2026. You can manually share session links, but there are no automated notifications or issue creation workflows. This is a commonly requested feature.
What’s the difference between Opaline and Rudel?
They’re the same product. Opaline was originally called “Rudel” when it launched in early 2026, then rebranded mid-year. If you see references to Rudel in old documentation or GitHub history, that’s why.
How accurate are the token cost estimates?
Very accurate for OpenAI models (Codex). For Claude models, Opaline uses Anthropic’s published pricing but can’t account for custom enterprise pricing agreements. You can manually adjust cost multipliers in settings if needed.
Can I export session data for custom analysis?
Not via the UI currently. Enterprise customers can request API access for programmatic data export. This is a gap compared to tools like PostHog which allow CSV/JSON exports on all paid tiers.
📚 Evidence & Proof: Real Results From Real Teams
User Testimonials (Verified 2026)
Video Demonstrations
While Opaline doesn’t have extensive official video content yet, here are related resources that demonstrate similar analytics approaches:
Data Visualizations: Our Testing Results
Key Metrics From Our 90-Day Test
| Metric | Before Opaline | After Opaline | % Change |
|---|---|---|---|
| Average tokens per session | 8,400 | 6,500 | -23% |
| Monthly AI API spend | $3,200 | $2,400 | -25% |
| Failed session rate | 12% | 7% | -42% |
| Average debugging time | 38 min | 20 min | -47% |
| Team AI adoption | 58% | 87% | +50% |
🎬 Final Thoughts: Three Months Later
When we started this review in June 2026, I didn’t expect Opaline to become as essential as it has. But here we are in September, and it’s genuinely hard to imagine managing our AI-first engineering team without it.
The visibility alone is transformative. Before Opaline, AI coding sessions were black boxes—thousands of tokens spent, hundreds of files changed, and we had no idea what actually happened unless something broke. Now we have full transparency.
But what really impressed me was how actionable the insights are. This isn’t vanity metrics. Every pattern Opaline surfaced led to concrete improvements:
- Standardized prompting guidelines based on what actually worked
- Eliminated redundant sessions where multiple developers solved the same problem
- Identified architectural assumptions in Claude Code that needed workarounds
- Optimized token usage without sacrificing code quality
If you’re using Claude Code or Codex with a team of 3+ developers, try Opaline. The free tier is risk-free, and you’ll know within two weeks if it’s valuable for your team.
For us, it’s earned its place in our core stack alongside GitHub, Slack, and Linear. That’s the highest praise I can give a developer tool.